Revenue Operations, rising to the occasion.
A guided program and workspace for RevOps and GTM leaders: diagnose the state of the revenue engine, run proven playbooks, orchestrate the change that makes them stick — then show the people who fund the work exactly what it was worth.
A maturity model, not another dashboard.
Every workspace gets a blended score per stage — 60% from a structured diagnostic, 40% from real usage signals in the workspace. You see the truth, and you see what to fix first.
Everything RevOps needs to drive change.
One workspace for diagnosis, execution, governance, and AI — sequenced so you build the foundation before automating it.
Benchmark your revenue engine across four stages in under five minutes.
Combine diagnostic answers with real CRM and workspace usage — no wishful thinking.
Build ICPs, capacity models, segments, and sequences inside guided frameworks.
One-week recovery plans generated for any failing check, linked to the exact checklist item.
Template-driven agendas, pre-flight acknowledgments, AI meeting recaps.
Rules watch for pipeline risk or activity gaps and route work to the right owner.
What changed, what shipped, and what it is worth — priced from your own plan, with the arithmetic shown. Shareable with people who have no login.
What it actually looks like.
Real screens, captured from the product. The company is fictional; nothing else here is a mockup.
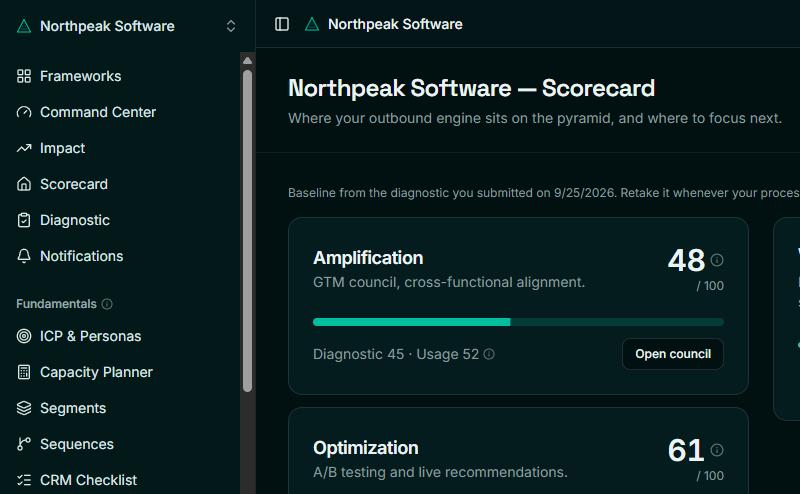
Know where you actually stand
Four stages, each scored 60% from your diagnostic and 40% from what the workspace can observe. The split is shown, so a score you disagree with can be argued with rather than taken on faith.
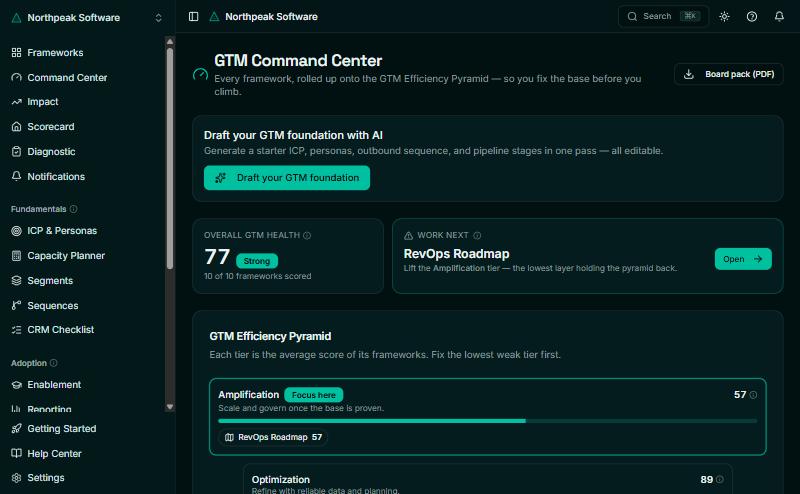
One screen that says what to fix first
Every framework rolled onto the pyramid. It reads bottom-up and names the first tier below threshold — not the lowest number, because the lowest number is usually a symptom of something underneath it.
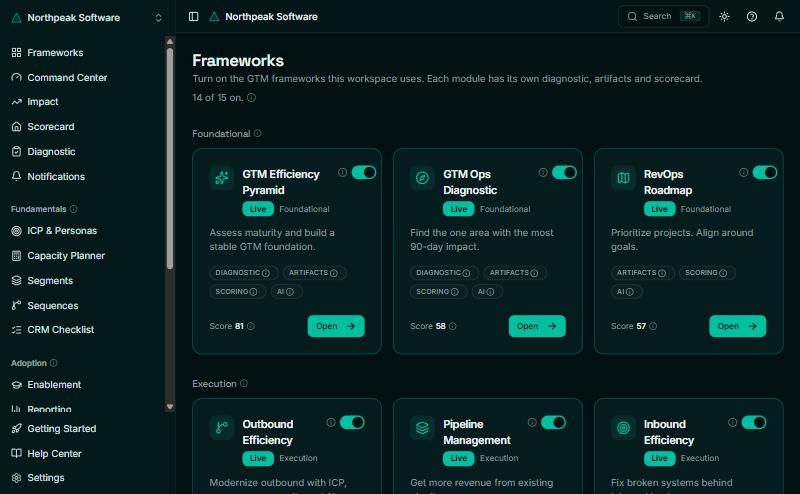
Turn on only what you run
Fourteen modules, each with its own diagnostic, artifacts and score. Switch on the motions you actually operate and the rest stay out of your way.
What you send upstairs.
A read-only link, no login for whoever opens it. These are the real charts from a real report — the figures below belong to a fictional company, the rendering does not.
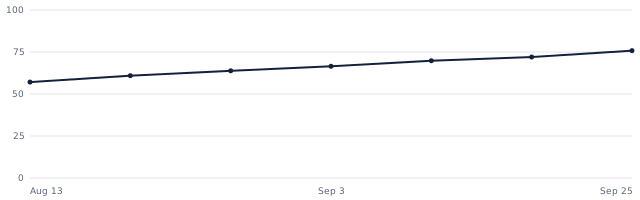
A fixed cohort, so taking on a new area cannot read as a decline.
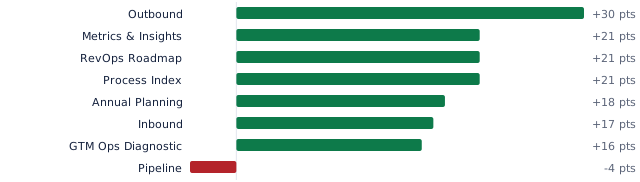
Including the one that went backwards. A report that only showed gains would invite the question of what it left out.
Work shipped and maturity moved are counts and measurements. Nothing inferred.
Priced from your own plan, with the calculation printed so a CFO can check it rather than trust it.
Only six metrics have a revenue link it will defend. The rest are reported as moved, deliberately not priced.
Proven RevOps frameworks, ready to run.
Turn on the playbooks your team needs. Each one comes with its own diagnostic, artifacts, and scorecard — so progress is measurable, not anecdotal.
Diagnose. Fix. Govern. Amplify.
- 01DiagnoseTake a 16-question assessment and get a per-stage baseline score.
- 02Fix the fundamentalsRun guided playbooks to close ICP, capacity, and CRM gaps.
- 03Adopt & governEnablement, weekly reviews, and a GTM Council keep the team aligned.
- 04Optimize & amplifyUnlock AI experiments and trigger automations once the base is solid.
Ready to rise?
Spin up a workspace, run the diagnostic, and see the first three plays your revenue engine needs — in about five minutes.